Home screen with CGM in Manual Mode
Device: MiniMed™ 780G insulin pump
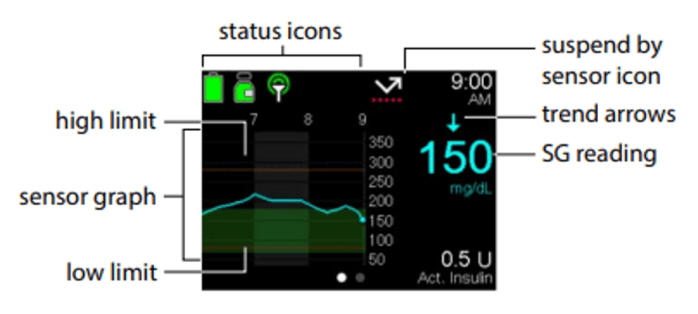
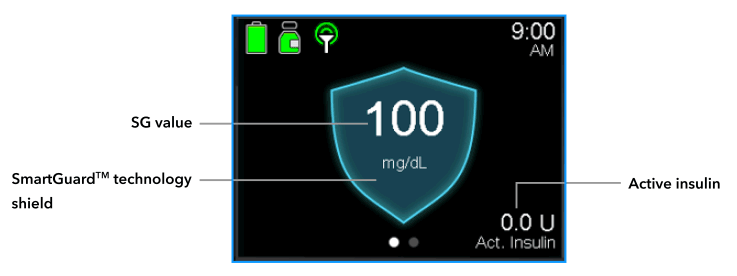
When the Sensor feature is active, the Home screen displays a real-time graph that shows sensor glucose (SG) information.
Manual Mode Sensor display:

SmartGuard™ technology Sensor display:

Status icons:
The status icons provide the current status of the pump system.
| Icon name | Description |
|---|---|
| Connection | The connection icon shows the following information:
|
| Sensor status | The sensor status icon shows whether the sensor is warming up, is monitoring sensor glucose (SG) values, a BG is required, or the sensor status is unavailable. The icon appears only when the Sensor feature is turned on.
|
| Sensor life | The number on the sensor life icon indicates the number of days that remain in the life of the sensor. The icon appears on the Status screen and only when the Sensor feature is turned on. After a new sensor is inserted, the icon is solid green. When one day remains in the life of the sensor, the icon turns red. When the sensor expires, the icon turns solid black with an X.  If the number of days that remain in the life of the sensor is not yet available, such as when the sensor is warming up, the sensor life icon appears with three dots.  If the number of days that remain in the life of the sensor is unknown, the sensor life icon appears with a question mark. 
|
| Suspend by sensor | When the current low alert time segment has either the Suspend before low or Suspend on low feature turned on, the Suspend by sensor icon appears on the Home screen. When Suspend before low or Suspend on low feature suspends insulin delivery, the icon flashes If the Suspend before low or Suspend on low feature is turned on but unavailable, the icon has a red X. |
| Alert silence | The Alert silence icon  indicates that the Alert Silence feature is turned on and some alerts will not make a sound or vibration. Sensor alerts can be silenced for a specific duration using the Alert silence feature. For more information, see silencing sensor alerts. indicates that the Alert Silence feature is turned on and some alerts will not make a sound or vibration. Sensor alerts can be silenced for a specific duration using the Alert silence feature. For more information, see silencing sensor alerts. |
The sensor graph with CGM in Manual Mode
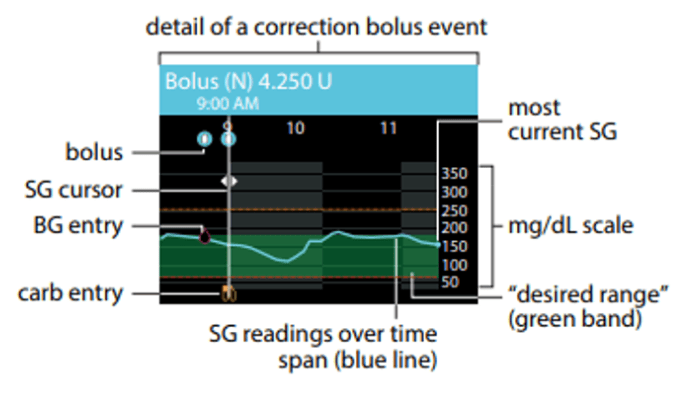
The sensor graph provides current SG reading information that is transmitted to the pump. If the MiniMed™ Mobile app is in use, the sensor graph can be viewed on a mobile device.

The sensor graph includes the following information:
- The most recent SG reading.
- Historical SG readings for the last 3-hour, 6-hour, 12-hour, or 24-hour periods.
- High and low SG limits.
- Carb entries.
- Boluses delivered during the time period displayed on the graph.
- Suspend events caused by Suspend before low or Suspend on low.
- BG entries
To view the sensor graph:
- From the Home screen, press the Graph button. A full-screen view of the 3-hour graph appears.
- Press up arrow to navigate to the 6-hour, 12-hour, and 24-hour graphs.
- Press left arrow to view SG readings and event details.
- To exit the full-screen view, press the Back button or press the Select button again.
System support User guides and manuals
 The Sensor feature is on and communicating.
  The Sensor feature is on, but the sensor is not communicating with the pump.
  A solid green icon with a circle around it means the sensor is working and no action is required.
  A red icon means a BG reading is required.
  A question mark icon with a solid blue circle around it means that sensor information is unavailable.
 An icon with three white dots on a black background means the pump is waiting for the sensor status to update.

