Auto Mode sensor graph
Device: MiniMed™ 670G insulin pump (MMT-1780K)
Your Auto Mode sensor graph displays your current sensor glucose (SG) reading that is wirelessly sent to your pump by your transmitter.
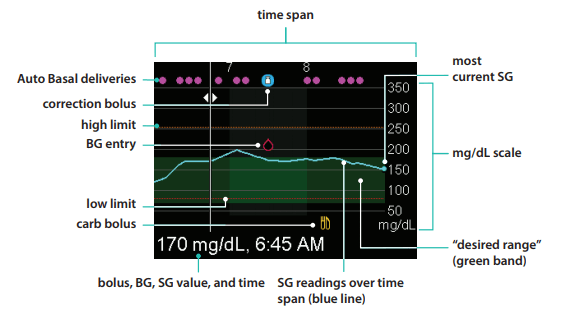
The Auto Mode sensor graph includes the following information:
- The selected SG or event details are displayed at the bottom of the screen.
- Historical sensor glucose readings are displayed for the last 3-hour, 6-hour, 12- hour, or 24-hour periods. They appear as a blue line across the screen.
- Correction boluses are shown as white vials inside blue circles.
- Meal (carb) boluses are shown as yellow knife and fork symbols. These represent any bolus amounts that include a carb entry.
- Blood glucose entries appear as red drop symbols.
- The numerous small magenta dots along the top represent the automatically delivered basal insulin (Auto Basal or Safe Basal) delivered by Auto Mode.
- A time change event appears as a white clock symbol.
If an SG reading does not appear on the graph, some possible reasons for this include:
- An error condition or a sensor-related alert is occurring.
- A new sensor that you just inserted is still initializing.
- A new sensor that just initialized is still calibrating.
- An existing sensor that you have recently reconnected is not ready.
- More than six hours have passed since the initial sensor calibration.
- More than 12 hours have passed since the last sensor calibration.
To view the sensor graph: