Reading your sensor graphs
Device: MiniMed™ 670G insulin pump (MMT-1780K)
Sensor Graph
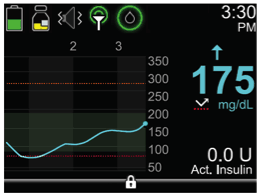
A graph that shows the last 3 hours of sensor glucose readings will always display on the Home screen. Your high glucose limit entered in your sensor settings will be shown in orange, and your low glucose limit will be shown in red.
Additional Sensor Graphs
In addition to the 3-hour graph, you can also view 6-hour, 12-hour and 24-hour glucose trend graphs.
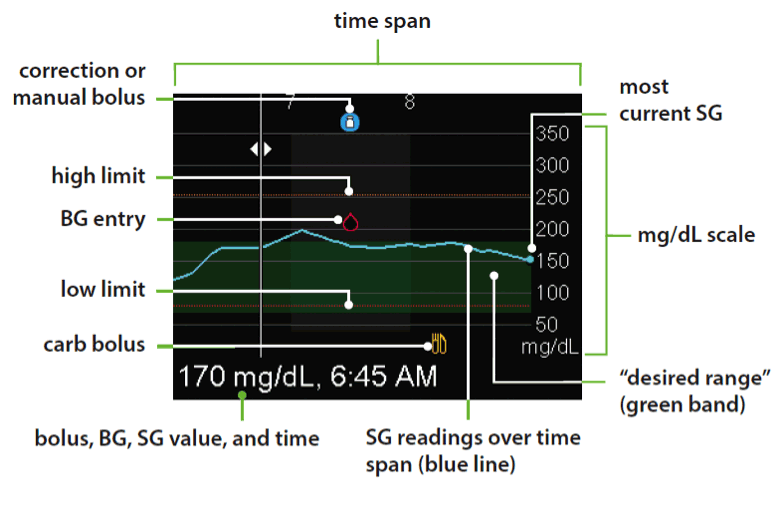
The graph shows a range of SG values from 40 mg/dL to 400 mg/dL. The green band across the screen represents an SG range from 70 mg/dL to 180 mg/dL. The blue line shows your actual SG values over the time span. At the right end of the blue line is a blue dot representing the most current SG value.
Details about correction bolus, BG entry, and meal (carb) bolus are shown on the graph. To locate details for an icon, look for the icon on the graph, and press left or right to scroll to that icon. The details for that icon are located along the bottom of the screen. Icons shown on the graph are:
 - indicates either a correction bolus or manual bolus
 - indicates a BG entered either manually or using a meter
 - indicates a bolus that includes a carb entry; it displays for a carb only or a carb plus correction bolus
Press left or right to cycle through the time span. The SG values and times, BG readings and times, and Bolus amounts display along the bottom of the screen.
A bolus amount followed by an (N) indicates a normal bolus delivered through the bolus feature. A BG entry is labeled BG, for example: BG, 121 mg/dL, 12:30pm. An SG is displayed with the value and time only, for example: 121 mg/dL, 12:35pm.
Press up or down to change the time span shown on the graph. The choices are 3 hours, 6 hours, 12 hours, and 24 hours.
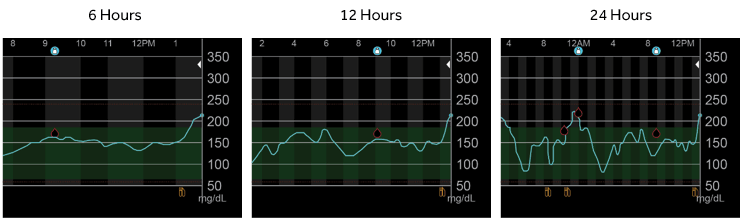
A gold shaded area represents time when insulin was suspended due to a Suspend on low or a Suspend before low event. To access these graphs:
- From the Home screen, press the Graph button.
A full-screen view of the 3-hour graph appears. - Press Left to scroll back over the graph. Sensor values will be shown at the bottom of the graph.
- Press Up to see the 6-hour, 12-hour and 24-hour graphs.
- Press Back or press the Graph button to return to the Home screen.