Sensor graph with SmartGuard™ feature
Device: MiniMed™ 780G insulin pump
Pump software version: 6.21, 6.42, and 6.61 (Find software version)
Your SmartGuard™ Auto Mode sensor graph displays your current sensor glucose (SG) reading that is wirelessly sent to your pump by your transmitter.
To view the sensor graph:
From the Home screen, press the Graph button. A full-screen view of the 3-hour graph appears.
Press the Up arrow to navigate to the 6-hour, 12-hour, and 24-hour graphs.
Press the Left arrow to view SG readings and event details.
To exit the full-screen view, press the Back button or press the Graph button again.
The SmartGuard™ feature sensor graph includes the following information:
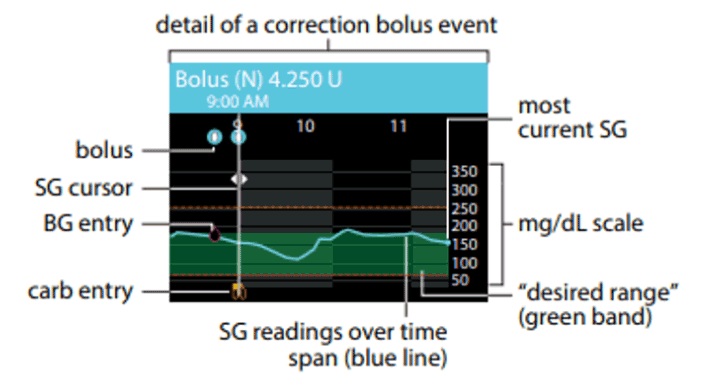
When a location on the graph is selected, specific details of the SG or event appear, such as a correction bolus.
Historical SG readings are displayed for the last 3-hour, 6-hour, 12-hour, or 24-hour periods. They appear as a blue line across the screen.
Boluses are shown as white vials inside blue circles.
Carb entries are shown as yellow knife and fork symbols. These represent any bolus amounts that include a carb entry.
BG entries appear as red drop symbols. Magenta bands across the top represent auto basal deliveries provided by the SmartGuard feature.
Blue vertical bars at the top represent auto correction boluses delivered by the SmartGuard feature.
A time change event appears as a white clock symbol.
Temp target is shown as green runners.
System support User guides and manuals